“The launch of Graphical Analysis for Android helps meet the growing demand for data analysis on Android devices designed for the classroom,” said David Vernier, co-founder of Vernier and a former physics teacher. “Increasingly, teachers in the U.S., Europe, and Asia are asking for data analysis that supports Android devices. Our goal is to support science teachers on the range of devices they are using for hands-on science instruction.”
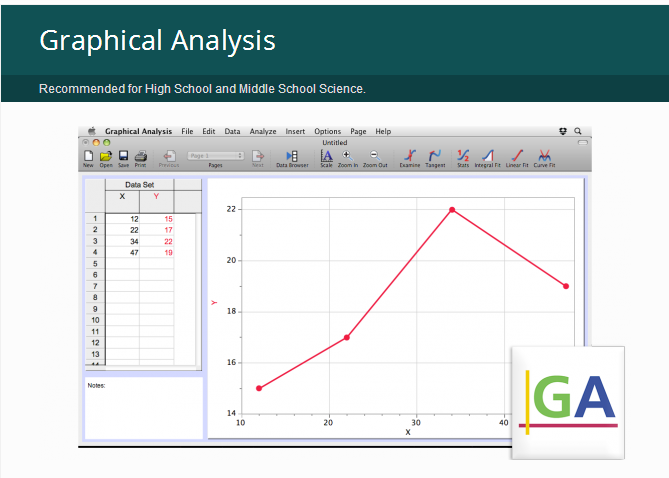
Students can use Graphical Analysis for Android with existing Vernier sensors to simultaneously collect and graph data from multiple sensors. Additionally, students can graph manually entered data, and access the same analysis and annotation features used for sensor-based data collection.
Graphical Analysis for Android will be available via Google Play this spring, and a time-limited, free preview is now available.
About Vernier Software & Technology
Vernier Software & Technology has been a leading innovator of scientific data-collection technology for 33 years. Focused on science, technology, engineering, and mathematics (STEM), Vernier is dedicated to developing creative ways to teach and learn using hands-on science. Vernier is a U.S.-based company, with offices in Europe and Asia and dealers servicing more than 130 countries.
Vernier creates easy-to-use and affordable science interfaces, sensors, and graphing/analysis software that are used by educators and students from elementary school to university. Vernier’s technology-based solutions enhance STEM education, increase learning, build students' critical thinking skills, and support the science and engineering practices detailed in the Next Generation Science Standards (NGSS).
Vernier’s business culture is grounded in Earth-friendly policies and practices, and the company provides a family-friendly workplace. For more information, visit www.vernier.com.


