Author: Anna Warfield
Storyboard That is the world’s best online storyboard creator, and we just keep getting better and better. We have made lots of improvements for a more user-friendly, more beautiful, more diverse, and more varied experience. Storyboard That is already a classroom favorite and as we continue our education focus, our graphic organizer capabilities have exploded!. Here is a look at some changes we have made to enhance your storyboarding needs!
Storyboard Layouts
The Storyboard That art library has thousands of scenes, characters, and searchable items. Photos For Class is integrated into the search function, so all photos are automatically cited on your storyboard. We listened to teacher feedback about Storyboard That in the classroom, and came up with some great new offerings for organizing and presenting ideas.
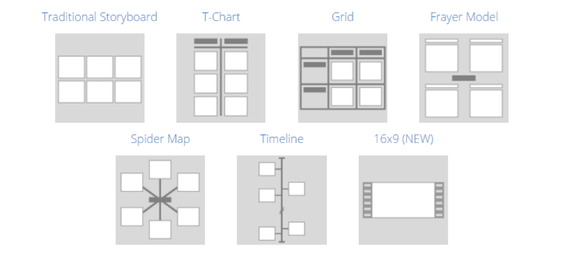
In addition to the traditional storyboard layout, you can now make different graphic organizers. We have storyboard layouts for a spider map, grid, timeline, Frayer Model, and T-Chart. Our newest addition is the 16X9 layout, perfect for film planning or digital storytelling in greater detail.
The Storyboard That art library has thousands of scenes, characters, and searchable items. Photos For Class is integrated into the search function, so all photos are automatically cited on your storyboard. We listened to teacher feedback about Storyboard That in the classroom, and came up with some great new offerings for organizing and presenting ideas.
In addition to the traditional storyboard layout, you can now make different graphic organizers. We have storyboard layouts for a spider map, grid, timeline, Frayer Model, and T-Chart. Our newest addition is the 16X9 layout, perfect for film planning or digital storytelling in greater detail.
Cell Layouts
There are four options for the cell layouts. You can have the cell by itself, add a title, add a description, or add a title and description. The cell options are available for ALL of the storyboard layouts.
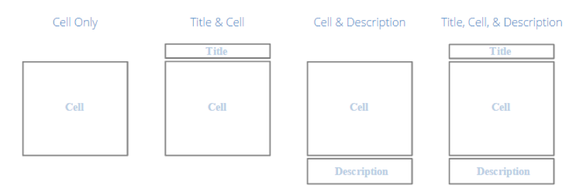
Not only do cell layout options enhance the clarity of whatever message you want to convey, but also deepen the amount of detail that you can include. Save the cell itself for vivid images; often, less is more, but sometimes more text is required to show importance or explain significance.
History Teacher Guides
Storyboard That already has many teacher guides on significant historical events and periods, as well as primary source analyses on seminal documents. After the success of our ELA Teacher Guides, we are now aiming to be just as amazing in history topics.
We are continually adding historically accurate scenes, characters, and items to make sure your storyboards are the best. Engage students with anecdotes and comics to explain big ideas and historical significance.Take a look at some of the ways you can incorporate Storyboard That into your history class.
Timeline
The timeline layout was made to enhance student understanding in history. Putting events in order, or seeing preceding events to understand cause and effect, is extremely important. Events can unfold in a surprising manner, and it is helpful to see the progression of and connection between events.
5 Ws
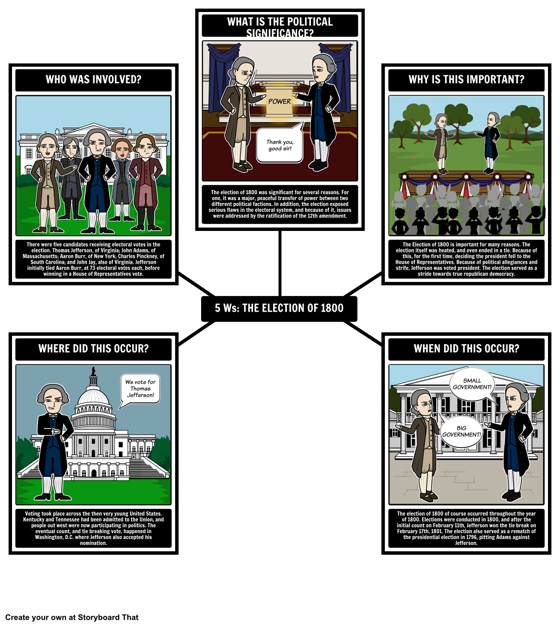
The 5 Ws activity with the spider map layout is one of our favorites. The 5 Ws (Who, What, Where, When, and Why) really help students get at the meat of a topic, event, or document. With a spider map, there is less stress on sequential order that is sometimes felt with a traditional storyboard and definitely with the timeline. The spider map gives equal consideration to all of the ideas.
Timeline
The timeline layout was made to enhance student understanding in history. Putting events in order, or seeing preceding events to understand cause and effect, is extremely important. Events can unfold in a surprising manner, and it is helpful to see the progression of and connection between events.
5 Ws
The 5 Ws activity with the spider map layout is one of our favorites. The 5 Ws (Who, What, Where, When, and Why) really help students get at the meat of a topic, event, or document. With a spider map, there is less stress on sequential order that is sometimes felt with a traditional storyboard and definitely with the timeline. The spider map gives equal consideration to all of the ideas.
T-Chart
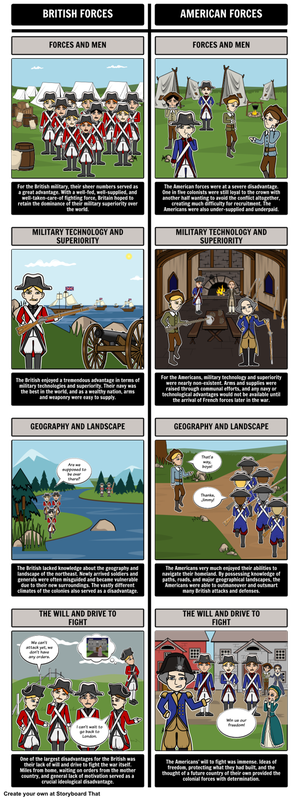
The T-Chart is such a versatile graphic organizer, that we couldn’t wait to put it into action. Place opposing forces on either side of the T and make comparisons. Or, use a T-Chart for before and after, pros and cons, or cause and effect comparisons. You can also make multiple columns on Storyboard That for Venn Diagrams or more complex comparisons.
The T-Chart is such a versatile graphic organizer, that we couldn’t wait to put it into action. Place opposing forces on either side of the T and make comparisons. Or, use a T-Chart for before and after, pros and cons, or cause and effect comparisons. You can also make multiple columns on Storyboard That for Venn Diagrams or more complex comparisons.

If you haven’t done so already, take a look at the available teacher resources for US History, World History, Elementary Grades, Middle School and High School ELA, and more. These teacher resources are meant to use as lesson plans, activity ideas, or just a springboard for your own creativity!
About the Author:
Anna Warfield (@AnnaMYWarfield) is a former elementary school teacher with a passion for learning and teaching. She is now the Head of Curriculum and Content at Storyboard That. History is one of her favorite subjects, and she is always looking for new ways to engage students in and out of the classroom.