
FilterED is an adaptive, cloud-based tool that offers school leaders a comprehensive view of the current technology landscape within their schools and/or district. School leaders can use FilterED to get the evidence, data, and context needed to prioritize, implement, measure, and monitor ongoing technology initiatives.
Using FilterED’s unique inventory, school leaders can answer questions like “What does the current technology landscape look like?”, “What is the cost of failed technology installations?”, “What kind of evidence can we supply in support of our learning ecosystem?” and many more.
Overall, FilterED identifies strengths and perceived gaps/conflicts that keep an organization from growing and improving. It is designed to help school leaders understand your current state, and help you plan accordingly for where you want to go. It helps school leaders answer the question, “What’s the return on learning?” for technology adoptions and implementations.
Before jumping into the review, here is an overview video from the FilterED team:
The overall goal of FilterED is to provide school and district leaders with an accurate picture of their technology ecosystem, through their Technology Adoption & Implementation Model. Rather than just relying on test scores, or number of devices, or device usage, FilterED aims to go beyond that to provide a more detailed, nuanced, and layered picture of how and why technology is being used across a district. From there, the FilterED team also offers resources, and potential action items, to help districts move forward.
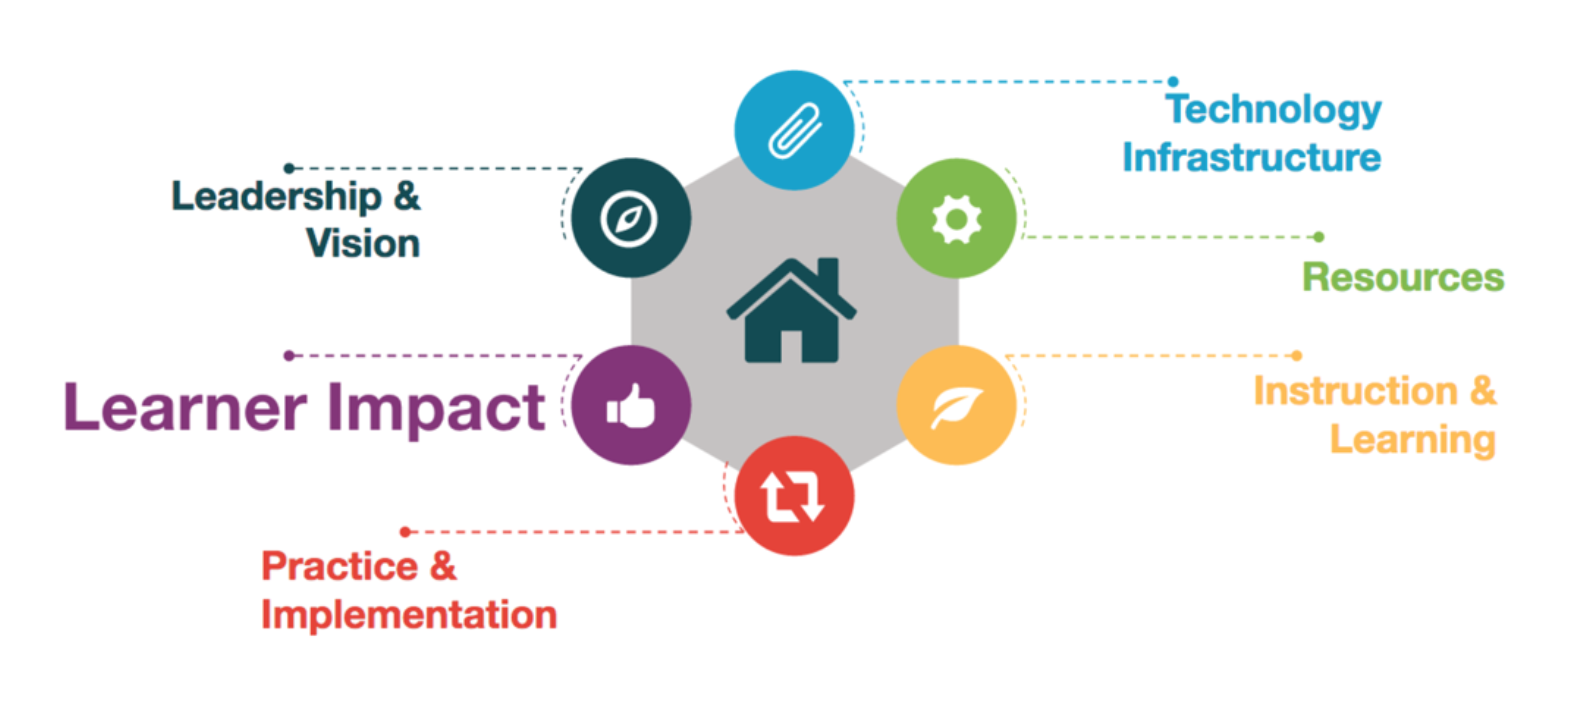
The Technology Adoption & Implementation Model begins with an inventory that surveys school and district staff across 6 key areas: Leadership & Vision, Learner Impact, Practice & Implementation, Technology Infrastructure, Resources, and Instruction & Learning.
From the results of that inventory, the FilterED team is able to construct a dashboard that includes a detailed breakdown of strengths and gaps across the district. This breakdown begins with an examination of the overall organization capacity. In addition to showing this information, FilterED also includes questions and prompts that district leaders can ask themselves as they move through the data.
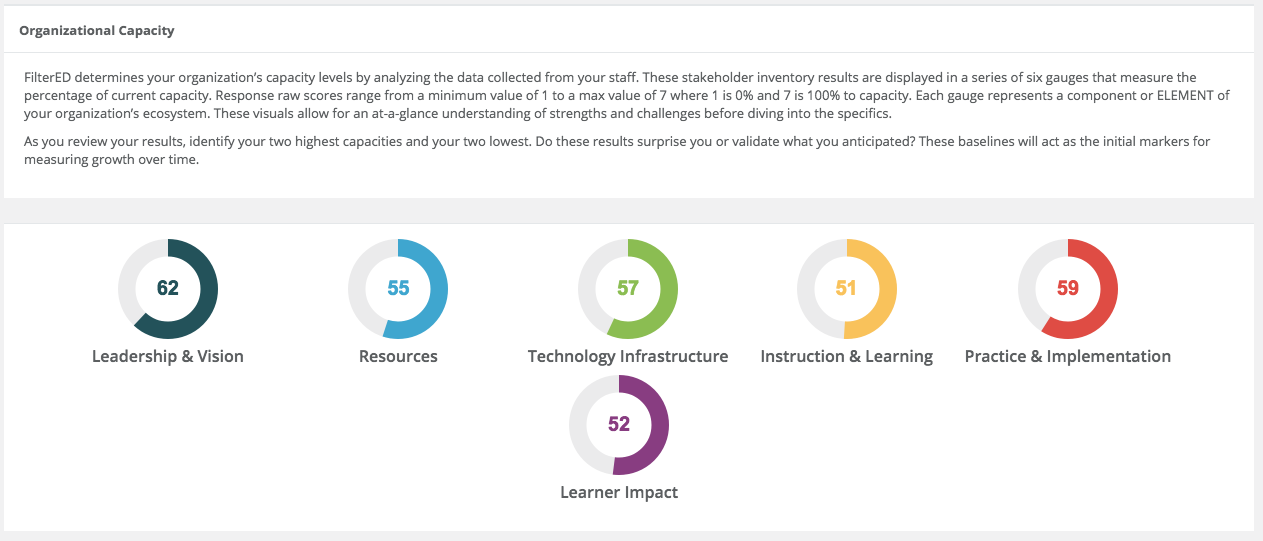
Districts are also provided with big picture Bright Spots and Opportunities for Growth. These are pulled from across all six of the main categories, and are meant to represent the overall themes for strengths and areas for improvement.

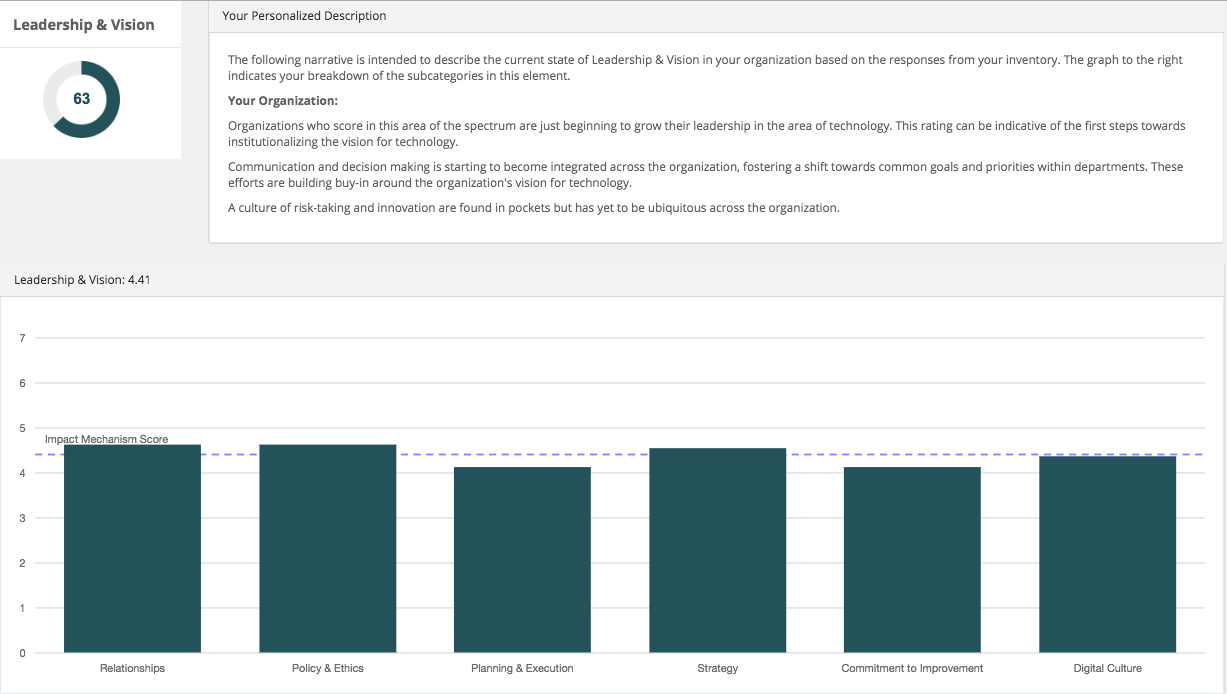
In addition to this big picture information, school leaders can also get more granular and look at the breakdown within each of the six areas. FilterED provides a personalized description of a district’s status within each of the areas, as well as additional and more specific bright spots and opportunities for growth within the area.
Plus, leaders can get even more granular than that, and look at the results by stakeholder, by grade level, by building, and by department. The FilterED team also provides specific recommendations and calls to actions, as well as alignment between ISTE, CoSN, and Future Ready standards and frameworks.
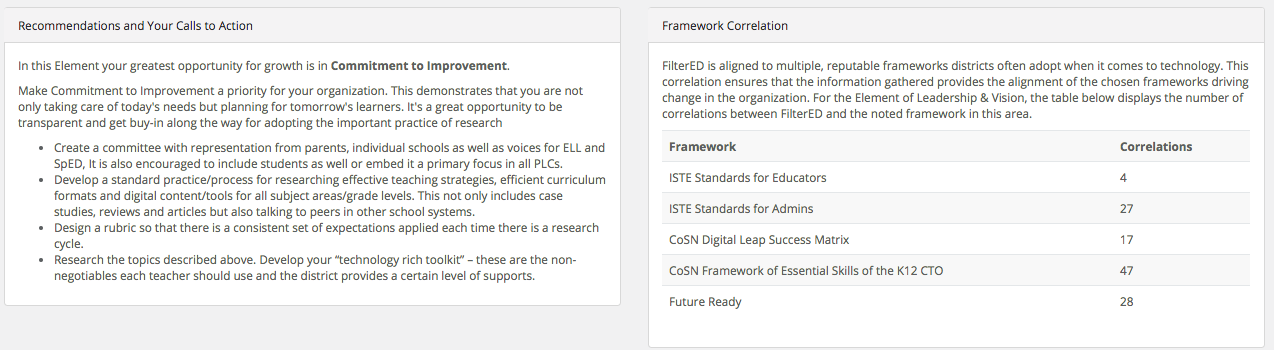
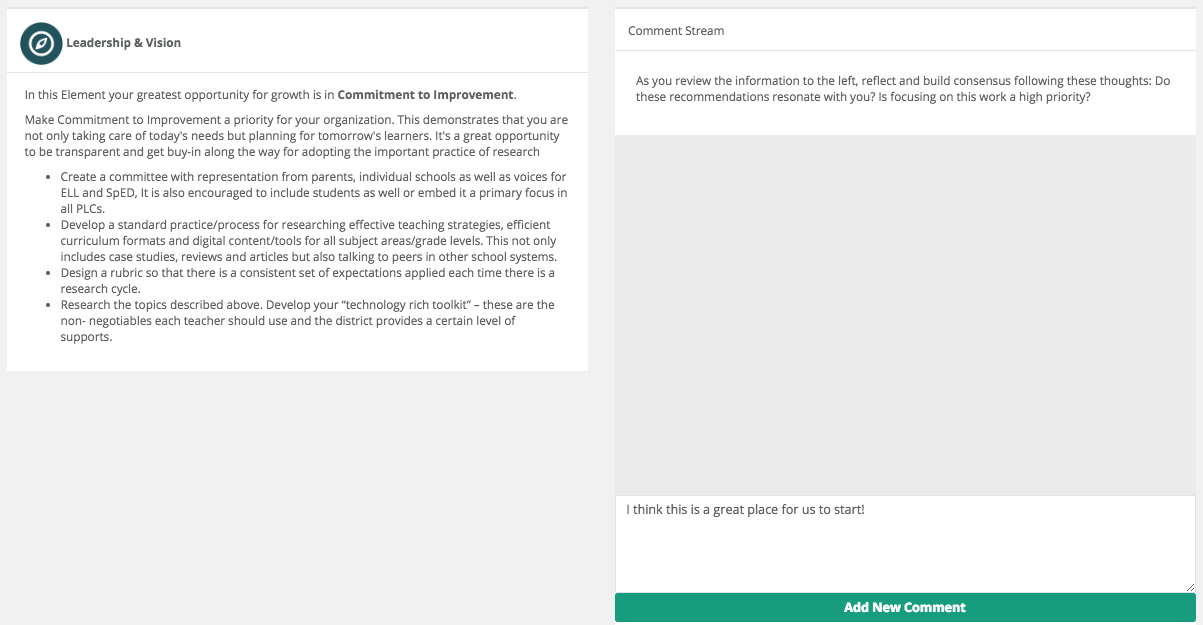
While districts are working on strategies and implementation plans moving forward, they can also discuss the specific recommendations and calls to action within the FilterED system. From the recommendations page, leaders can see the specific recommendations for each of the six areas, and engage in a discussion surrounding those recommendations.
Finally, in addition to everything available at the district level, one of my favorite feature is that (with a state or region implementation) folks at the state or Education Service Agency level can also use this information to get a better understanding of how schools across the state or region are progressing towards certain measures and indicators. This can be incorporated into the state’s framework of choice to align to existing initiatives such as Future Ready (something like this to explain why we switched from FilterED categories to Future Ready on this view!)

Overall, I’m a big fan of FilterED. Having an accurate and nuanced understanding of what technology looks like across a district is an absolute imperative for school leaders. FilterED provides leaders with a way to make technology-related decisions that are informed by a rich, district-wide understanding of what the actual technology landscape looks like. Not just how many devices a district has, or what apps are being used, but how students and teachers are actually interacting with technology on a daily basis, and how they feel about those interactions as well.
For those schools and districts interested in learning more about FilterED, you can test out their micro-inventory as a great way to get started.

The opinions expressed in this review are my own.
I was not compensated for writing this review.
I was not compensated for writing this review.


 RSS Feed